- Published on
Release of Admin-Dash v1: A Fully Customizable Admin Dashboard
- Authors
- Name
- Sam Mark
- @Twitter/smmk


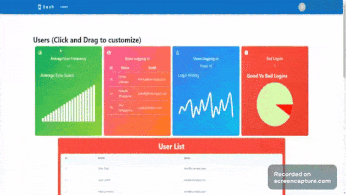
Admin Dashboard for User Management v1

Get a live Demo Here.
Get the source code here.
As businesses grow and expand, managing user data becomes a critical task. To streamline this process, I embarked on a project to develop an Admin Dashboard for User Management. The goal was to create a user-friendly interface that provides comprehensive user data and key metrics in a visually appealing manner and customizable format. In this article, I will walk you through the features, technologies used, and how to get started with this powerful dashboard built using React.
Features
The Admin Dashboard for User Management offers several impressive features that make user data management a breeze. Here are the key features of this dashboard:
Responsive Design
In today's world where users access applications from various devices, having a responsive design is essential. The Admin Dashboard is designed to adapt to different screen sizes, ensuring a consistent user experience across devices. Whether accessed from a desktop computer or a mobile phone, the dashboard will display flawlessly.
Resizable and Rearrangeable Layout
Customization is a key aspect of this dashboard. The Admin Dashboard utilizes the react-grid-layout library, which enables resizable and rearrangeable grid layout functionality. Administrators can easily customize the layout by clicking and dragging the components, tailoring the dashboard to their specific needs.
import ...

const UsersPage = () => {
  const layout = [
    { i: 'latestUser', x: 0, y: 0, w: 3, h: 2, minH: 2, minW: 3 },
    { i: 'usersLoggingIn', x: 3, y: 0, w: 3, h: 2 },
  ];

  const getLayouts = () => {
    const savedLayouts = localStorage.getItem('grid-layout');

    return savedLayouts ? JSON.parse(savedLayouts) : { lg: layout };
  };
  const handleLayoutChange = (layout, layouts) => {
    localStorage.setItem('grid-layout', JSON.stringify(layouts));
  };
  const [userStats, setUserStats] = useState(null);
  const ResponsiveGridLayout = WidthProvider(Responsive);

  useEffect(() => {
    fetchUserStats().then((data) => {
      setUserStats(data);
    });
  }, []);
  return (
    <div className="container mx-auto my-4">
      ...
      <ResponsiveGridLayout
        layouts={getLayouts()}
        className="layout"
        breakpoints={{ lg: 1200, md: 996, sm: 768, xs: 480, xxs: 0 }}
        cols={{ lg: 12, md: 10, sm: 6, xs: 4, xxs: 2 }}
        rowHeight={200}
        onLayoutChange={handleLayoutChange}
      >
        <div
          key="latestUser"
        >
          <LatestUserDataTable />
        </div>
        <div
          key="usersLoggingIn"
        >
        ...
        </div>
        <div
          key="averageFrequency"
          data-grid={{ x: 6, y: 0, w: 3, h: 2 }}
        >
        ...
        </div>
        <div
          key="badLogins"
          data-grid={{ x: 9, y: 0, w: 3, h: 2 }}
        >
        ...
        </div>
        <div
          key="userlist"
          data-grid={{ x: 1, y: 10, w: 10, h: 7, minH: 7 }}
        >
         ...
        </div>
      </ResponsiveGridLayout>
    </div>
  );
};

export default UsersPage;
The following code snippet is responsible for saving the grid layout to the local storage of the machine, ensuring that the Admin Dashboard maintains its customized layout even after the page is reloaded:
const layout = [
  { i: 'latestUser', x: 0, y: 0, w: 3, h: 2, minH: 2, minW: 3 },
  { i: 'usersLoggingIn', x: 3, y: 0, w: 3, h: 2 },
]

const getLayouts = () => {
  const savedLayouts = localStorage.getItem('grid-layout')
  return savedLayouts ? JSON.parse(savedLayouts) : { lg: layout }
}

const handleLayoutChange = (layout, layouts) => {
  localStorage.setItem('grid-layout', JSON.stringify(layouts))
}

const [userStats, setUserStats] = useState(null)
const ResponsiveGridLayout = WidthProvider(Responsive)
In the code above, layout represents the initial configuration of the grid layout. The getLayouts function retrieves the saved layouts from the local storage using the key 'grid-layout'. If no layouts are found, it returns the default layout.
The handleLayoutChange function is called whenever the layout changes. It receives the updated layout and layouts as parameters. This function then saves the new layouts to the local storage, ensuring that the changes persist even after page reload.
The userStats state variable is used to store the user statistics data, and setUserStats is the corresponding state setter function.
The ResponsiveGridLayout component is created by wrapping the Responsive component from the react-grid-layout library with the WidthProvider higher-order component. This component enables the responsiveness and adaptability of the grid layout to different screen sizes.
By implementing this code, the Admin Dashboard's layout can be customized by the user, and the chosen configuration will be saved to the local storage, providing a consistent experience even after page reload.
To set up the React Grid Layout with the provided code snippet, follow these steps:
return (
  <div className="container mx-auto my-4">
    ...
    <ResponsiveGridLayout
      layouts={getLayouts()}
      className="layout"
      breakpoints={{ lg: 1200, md: 996, sm: 768, xs: 480, xxs: 0 }}
      cols={{ lg: 12, md: 10, sm: 6, xs: 4, xxs: 2 }}
      rowHeight={200}
      onLayoutChange={handleLayoutChange}
    >
      <div key="latestUser">
        <LatestUserDataTable />
      </div>
      <div key="usersLoggingIn">...</div>
      <div key="averageFrequency" data-grid={{ x: 6, y: 0, w: 3, h: 2 }}>
        ...
      </div>
      <div key="badLogins" data-grid={{ x: 9, y: 0, w: 3, h: 2 }}>
        ...
      </div>
      <div key="userlist" data-grid={{ x: 1, y: 10, w: 10, h: 7, minH: 7 }}>
        ...
      </div>
    </ResponsiveGridLayout>
  </div>
)
In the code snippet above, the ResponsiveGridLayout component is used to define the grid layout. Here's how you can set it up:
Wrap the grid layout code within a
<div>element with a class of "container mx-auto my-4" to apply appropriate margins and center the layout.Provide the initial layouts using the
layoutsprop, which should be assigned the result of thegetLayouts()function. This ensures that the saved layout is applied initially.Assign the class "layout" to the
classNameprop ofResponsiveGridLayoutfor styling purposes.Configure the breakpoints and corresponding column numbers using the
breakpointsandcolsprops. This determines the number of columns to be displayed at different screen sizes.Set the desired row height using the
rowHeightprop. In this case, a row height of 200 pixels is used.Specify the
onLayoutChangeprop with thehandleLayoutChangefunction to handle layout changes and save them to the local storage.Add child components within
<div>elements inside theResponsiveGridLayout. Each child component should have a uniquekeyprop.Customize the positioning and size of each child component using the
data-gridprop. Adjust thex,y,w,h, andminHvalues to define their position, width, height, and minimum height respectively.
By following these steps, you can set up the React Grid Layout in the Admin Dashboard, allowing for a customizable and responsive user interface for efficient user data management.
Special thanks to Iskander Samatov for the detailed article on how to use and persist react-grid-layout.
Utilizing Recharts for Customizable and Dynamic Graphical Components
The Admin Dashboard components utilize the Recharts library for creating visually appealing and interactive graphics. The flexibility of Recharts allows for easy customization and integration with data from any API or websocket. Let's take a closer look at an example UI component that utilizes Recharts:
import React, { useEffect, useState } from 'react'
import { AreaChart, Area, ResponsiveContainer } from 'recharts'
import { fetchUserLogins } from '../../data/Users'

const UsersLoginChart = () => {
  const [userLogins, setUserLogins] = useState([])

  useEffect(() => {
    fetchUserLogins().then((data) => {
      setUserLogins(data)
    })
  }, [])

  return (
    <div className="mb-6 rounded bg-transparent p-4 shadow-md">
      <h6 className="mb-4 text-xl">Login History</h6>
      <ResponsiveContainer width="100%" height={200}>
        <AreaChart data={userLogins}>
          <Area
            type="monotone"
            dataKey="count"
            stroke="#ffffff"
            strokeWidth={7}
            fill="transparent"
          />
        </AreaChart>
      </ResponsiveContainer>
    </div>
  )
}

export default UsersLoginChart
In the code snippet above, we have a component called UsersLoginChart that represents a chart displaying the login history. Here's how it works:
The component imports necessary dependencies from the Recharts library, such as
AreaChart,Area, andResponsiveContainer.Inside the component, we define the state variable
userLoginsusing theuseStatehook. It will hold the data for the user logins.The
useEffecthook is utilized to fetch user login data using thefetchUserLoginsfunction from the../../data/Usersmodule. Once the data is fetched, it is set to theuserLoginsstate variable.The component renders a
<div>element with appropriate styling classes, creating a container for the chart. It includes a heading for the chart, indicating its purpose.The
ResponsiveContainercomponent from Recharts is used to create a responsive chart container that adjusts its size based on the available space.Within the
ResponsiveContainer, anAreaChartcomponent is defined, which receives theuserLoginsdata as itsdataprop.Inside the
AreaChart, anAreacomponent is used to represent the actual area of the chart. It specifies thedataKeyas "count" to determine which data property to use for the chart values. Styling attributes likestroke,strokeWidth, andfillare customized to achieve the desired visual appearance.
By modifying the data fetching logic and the fetchUserLogins function, the UsersLoginChart component can be easily adapted to fetch data from any API or websocket. This flexibility enables administrators to seamlessly integrate real-time data or connect the dashboard to their preferred data sources, enhancing the chart's capabilities and providing valuable insights into user login history.
Faux Backend and Data Fetching Flexibility

The Admin Dashboard for User Management incorporates a faux backend implementation to simulate fetching user data and statistics. This approach provides a convenient way to develop and test the dashboard without relying on a real backend or external APIs. However, it's important to note that the dashboard is designed to be flexible and easily customizable to fetch data from various sources, including APIs or websockets.
const userData = [
  { id: 1, name: 'John Doe', email: 'john@example.com' },
  ...{ id: 24, name: 'James Wilson', email: 'james@example.com' },
]

const userStats = {
  lastUserLogin: 'John Doe',
  usersLoggingInToday: 10,
  averageUserFrequency: 3.5,
  badLogins: 2,
}

const userLogins = [{ date: '2023-06-01', count: 3 }, ...{ date: '2023-08-01', count: 2 }]

const timeSpent = [{ date: '2023-06-01', count: 10 }, ...{ date: '2023-08-01', count: 105 }]

const goodVsBadLogins = [
  { name: 'Good Logins', value: 200 },
  { name: 'Bad Logins', value: 20 },
]

export const fetchUsers = () => {
  return new Promise((resolve) => {
    resolve(userData)
  })
}

export const fetchUserStats = () => {
  return new Promise((resolve) => {
    resolve(userStats)
  })
}

export const fetchUserLogins = () => {
  return new Promise((resolve) => {
    resolve(userLogins)
  })
}

export const fetchGoodVsBadLogins = () => {
  return new Promise((resolve) => {
    resolve(goodVsBadLogins)
  })
}

export const fetchUserTimeSpent = () => {
  return new Promise((resolve) => {
    resolve(timeSpent)
  })
}
By decoupling the data fetching logic from the dashboard components, it becomes straightforward to switch from the faux backend to a live data source. This adaptability allows the dashboard to seamlessly integrate with real-time data feeds or APIs, making it a robust solution for monitoring and managing user activity.
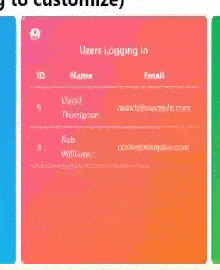
For instance, the "Recently Logged On Users" list can be dynamically updated to display users as they log on. This can be achieved by leveraging websockets, which provide real-time data transmission between the server and the client. By connecting the dashboard to a websocket server, the list can automatically update itself, reflecting the latest user logins in real-time.
To implement such functionality, modifications to the data fetching logic would be required. Instead of relying on the faux backend, the dashboard can be configured to subscribe to websocket events and receive updates whenever a user logs in or performs any relevant action. This approach ensures that the dashboard stays up to date with the latest user data, providing administrators with real-time insights and enhanced user management capabilities.
By offering this flexibility, the Admin Dashboard for User Management empowers administrators to adapt the data fetching mechanism according to their specific requirements. Whether it's fetching data from an API, utilizing websockets for real-time updates, or integrating with other data sources, the dashboard provides the foundation for a customizable and dynamic user management experience.
Technologies Used
To build this powerful Admin Dashboard, I utilized the following technologies:
React
React is a widely-used JavaScript library for building user interfaces. Its component-based architecture and virtual DOM make it highly efficient and flexible. Leveraging React allowed me to create a dynamic and interactive dashboard that provides a seamless user experience.
Material-UI
Material-UI is a popular UI component library for React. It provides a set of pre-designed components and styling options, allowing developers to create visually appealing interfaces with ease. By incorporating Material-UI components into the Admin Dashboard, I was able to achieve a modern and polished look.
react-grid-layout
The react-grid-layout library played a crucial role in enabling the resizable and rearrangeable layout of the dashboard. With this powerful grid layout library, administrators can effortlessly customize the dashboard's structure by dragging and resizing components.
Tailwind CSS
Tailwind CSS is a utility-first CSS framework that offers a highly customizable approach to styling web applications. It provides a comprehensive set of utility classes that can be combined to create unique and visually appealing designs. In the Admin Dashboard, I utilized Tailwind CSS to apply responsive layouts, spacing, colors, and other styling elements, resulting in a clean and modern user interface.
Recharts
Recharts is a charting library built with React components. It simplifies the process of creating beautiful and interactive charts by providing a wide range of customizable chart types, including line charts, bar charts, pie charts, and more. By integrating Recharts into the Admin Dashboard, I was able to visualize user statistics and other data in a clear and meaningful way, enabling administrators to gain insights at a glance.
These technologies, including React, Material-UI, react-grid-layout, Tailwind CSS, and Recharts, collectively contributed to the development of a visually appealing, customizable, and feature-rich Admin Dashboard. By leveraging their capabilities, I was able to create a powerful tool for efficient user management and data visualization.
Future Enhancements
While the Admin Dashboard for User Management already offers an impressive set of features, there is always room for improvement. Here are some potential future enhancements:
- Sales Dashboard: Extend the dashboard to include a sales-related metrics and charts section. This would provide administrators with valuable insights into the business's sales performance.
Conclusion
The Admin Dashboard for User Management is a powerful tool for efficiently managing user data and gaining valuable insights into user activity. Built using React, Material-UI, and react-grid-layout, this dashboard provides a seamless user experience with its responsive design and customizable layout. By following the steps outlined in this article, you can easily get started with the Admin Dashboard and take control of your user management tasks. Feel free to contribute to the project, suggest improvements, or submit pull requests as we continue to enhance this powerful tool.
Please Let me know if you'd like help or would like to have this dash customized for you application here.
To learn more about the project and its licensing details, visit the GitHub repository. Please feel free to leave and bugs/feedback or updates on the github page. I'll try to review any pull request if you would like to contribute.